EPI Insights: Protected Areas
Biodiversity underpins all ecosystem services that sustain our environment and power our economies. Intact and sufficient habitat is critical to supporting ecosystems and maintaining biodiversity. However, natural habitats have witnessed considerable declines in biodiversity in recent decades, and today many species are at risk of extinction. In order to quantify and track biodiversity and habitat levels country-by-country, researchers at Yale and Columbia Universities have assigned scores to 180 countries, which are reported in Environmental Performance Index (EPI).
In the 2018 EPI, released at the World Economic Forum in January, the EPI found that biodiversity levels and habitat protection have increased over the past decade, rising on a 0–100 scale from 45 to 58. The countries with the highest scores for Biodiversity & Habitat include Zambia, Botswana, Germany, the United Kingdom and Luxembourg, which all received scores above 96, while the countries with the lowest rankings include Libya, Cabo Verde, Lesotho, Haiti, and Afghanistan. The United States received a score of 71 for Biodiversity & Habitat.
Zambia and Botswana are relative outliers from the European countries that received the highest overall scores in the 2018 EPI. Zambia received the highest score in the issue category due to the government’s focus on conservation efforts, including sustainable management of its forests, water resources, and wetlands (Ministry of Lands, Natural Resources, and Environmental Protection, 2015, p. v). According to the World Protected Area Database, nearly 40% of Zambia’s total land area is protected (United Nations Environment Programme World Conservation Monitoring Centre, 2017b). The second-highest scoring country is Botswana, which has conserved 30% of its total terrestrial land area (UNEP-WCMC, 2018). Botswana’s success may be traced back to its strong, community-based conservation policies. The government formalized a community-based natural resource management policy (CBNRM) in 1997 that increased opportunities for ecotourism, conservation, and economic development (Chevallier & Harvy, 2016, p. 2).
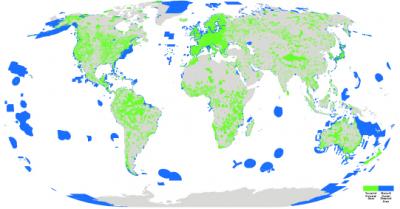
Overall, protected areas now cover about 15% of the planet’s terrestrial and inland water ecosystems, 4% of the global ocean, and 10% of coastal and marine areas under national jurisdiction.

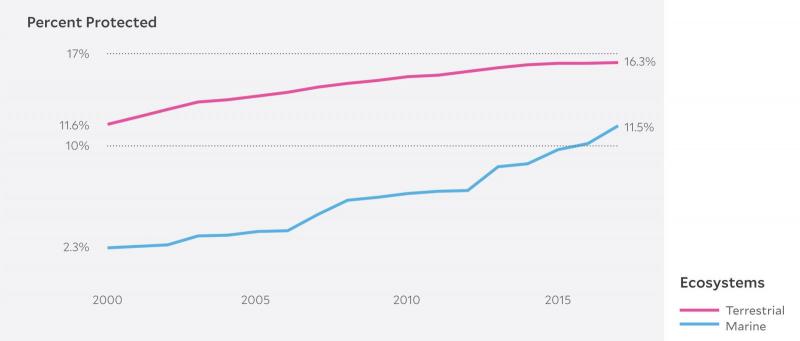
The Aichi Biodiversity Targets adopted under the Convention on Biological Diversity state that, “by 2020, at least 17 per cent of terrestrial and inland water, and 10 per cent of coastal and marine areas especially areas of particular importance for biodiversity and ecosystem service, are conserved.” Marine Protected Areas have already achieved the aforementioned 2020 target, while Terrestrial Protected Areas have increased but at a slower rate. In addition to the Aichi Targets, two goals under the Sustainable Development Goals (SDGs) directly relate to Biodiversity & Habitat: Goal 14 on oceans and Goal 15 on terrestrial habitat.
Additional indicators measuring terrestrial protected areas suggest, however, that more work needs to be done to ensure the presence of high-quality habitat and several challenges. First, the total size of Protected Areas is not the only consideration in maintaining biodiversity. The quality of habitat, the stringency with which they offer protection, and the ultimate effectiveness of the area for preserving biodiversity are also critical considerations. Second, the Aichi Targets may not be ambitious enough and should be revisited. Third, biodiversity faces additional threats besides habitat degradation.

The Biodiversity & Habitat issue category of the EPI seeks to evaluate a country’s performance in habitat conservation and species protection. The EPI adopted a series of six indicators to assess a country’s performance in biodiversity and habitat conservations for both terrestrial and marine ecosystems.
To understand both the extent of coverage and siting of ecologically important areas, the EPI weighs protected areas in relation to their size and type of biome. A country’s Biodiversity & Habitat score is comprised of the combination of the weighted scores of six indicators. These indicators reflect the many of the goals included in Aichi Biodiversity Targets:
- The percentage of a country’s exclusive economic zone designated as Marine Protected Areas;
- The percentage of terrestrial biomes in protected areas, weighted by national and global compositions of biomes;
- Species Protection Index;
- Protected Area Representativeness Index [PDF], which measures the extent to which terrestrial protected areas are ecologically representative; and
- Species Habitat Index, which measures the proportion of habitat in a country relative to 2001
Despite the fact that the global biodiversity scores have increased, biodiversity and habitat remain threatened, and it remains up to each country and region to continue to advocate for ecosystem health. The common adage, “you can’t manage what you don’t measure,” demonstrates the goal of the 2018 EPI, as it serves as a tool for countries to understand their rankings both temporally and comparatively. Through measuring habitat and biodiversity health, the EPI intends to provide countries with the knowledge and impetus to increase ecosystem protection.
EPI Insights is an ongoing series aimed at shedding light on the major policy highlights and findings of the 2018 Environmental Performance Index (EPI) report released this January in Davos, Switzerland. Each month, YCELP will feature a major benchmark included in the 2018 report and expand on the country rankings based on these metrics.